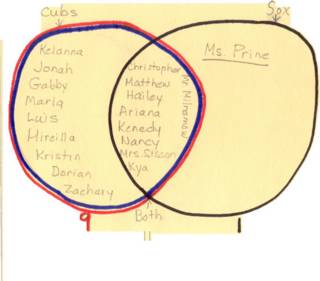
MATH: This week we are continuing our work with graphs and charts. We made a Venn diagram to show how many people in our class liked the Cubs, the White Sox, and both the Cubs and White Sox. As you can see, Ms. Prine is definitely in the minority, but she doesn't mind too much!
<< Home